World Bank API in Matlab#
by Vincent F. Scalfani
See the World Bank API documentation
These recipe examples were tested on February 12, 2022
1. Get list of country iso2Codes and names#
For obtaining data from the World Bank API, it is helpful to first obtain a list of country codes and names.
% define root WorldBank API
api = 'https://api.worldbank.org/v2/';

% define api url for getting couuntry code data
country_url = [api 'country/?format=json&per_page=500'];

% read the url and import data to Matlab as JSON data
country_data = webread(country_url);

% Extract out iso2code from countries data
country_iso2Code = extractfield(country_data{2,1}, 'iso2Code');

% Transform data
country_iso2Code = country_iso2Code';

% length of data
length(country_iso2Code)
   ans = 299
% display first 10
disp(country_iso2Code(1:10,:))
   {'AW'}
   {'ZH'}
   {'AF'}
   {'A9'}
   {'ZI'}
   {'AO'}
   {'AL'}
   {'AD'}
   {'1A'}
   {'AE'}
% Extract out country names
country_name = extractfield(country_data{2,1}, 'name');

% Transform data
country_name = country_name';

% length of data
length(country_name)
   ans = 299
% display first 10
disp(country_name(1:10,:))
    {'Aruba'                      }
    {'Africa Eastern and Southern'}
    {'Afghanistan'                }
    {'Africa'                     }
    {'Africa Western and Central' }
    {'Angola'                     }
    {'Albania'                    }
    {'Andorra'                    }
    {'Arab World'                 }
    {'United Arab Emirates'       }
% now combine country_iso2Code and country name
country_iso2code_name = [country_iso2Code country_name];
disp(country_iso2code_name(1:10,:))
    {'AW'}    {'Aruba'                      }
    {'ZH'}    {'Africa Eastern and Southern'}
    {'AF'}    {'Afghanistan'                }
    {'A9'}    {'Africa'                     }
    {'ZI'}    {'Africa Western and Central' }
    {'AO'}    {'Angola'                     }
    {'AL'}    {'Albania'                    }
    {'AD'}    {'Andorra'                    }
    {'1A'}    {'Arab World'                 }
    {'AE'}    {'United Arab Emirates'       }
Now we know the country iso2Codes which we can use to pull specific indicator data for countries.
2. Compile a Custom Indicator Dataset#
There are many availabe indicators: https://data.worldbank.org/indicator
We wll select three indicators for this example:
Scientific and Technical Journal Article Data = IP.JRN.ARTC.SC
Patent Applications, residents = IP.PAT.RESD
GDP per capita (current US$) Code = NY.GDP.PCAP.CD
Note that these three selected indictaors have a CC-BY 4.0 license We will compile this indicator data for the United States (US) and United Kingdom (GB)
% define indicators
indicators = {'IP.JRN.ARTC.SC','IP.PAT.RESD','NY.GDP.PCAP.CD'};

% generate the web API urls we need for U.S.
for j = 1:length(indicators)
    US_api_URL{j} = [api 'country/US/indicator/' indicators{j} '/?format=json&per_page=500'];
end

% retrieve data
for i = 1:length(US_api_URL)
    try
        US_indicator_data{i} = webread(char(US_api_URL(i)));

        % be kind to World Bank Servers, add a 1 second pause
        n = 1;
        pause(n)
    catch ME
        disp('not found')
    end
end

% generate web API urls we need for the UK (GB)
for j = 1:length(indicators)
    UK_api_URL{j} = [api 'country/GB/indicator/' indicators{j} '/?format=json&per_page=500'];
end

% retrieve data

for i = 1:length(UK_api_URL)
    try
        UK_indicator_data{i} = webread(char(UK_api_URL(i)));

        % be kind to World Bank Servers, add a 1 second pause
        n = 1;
        pause(n)
    catch ME
        disp('not found')
    end

end

% Extract the data and compile
% N.B. we can not use the Matlab extractfield function here because of the non empty cells

% US Data compilation
for k = 1:length(US_indicator_data{1,1}{2,1})

    % Scientific and Technical Journal Article Data Indicator Code = IP.JRN.ARTC.SC
    US_IPja_date{k} = US_indicator_data{1,1}{2,1}(k).date;
    US_IPja_value{k} = US_indicator_data{1,1}{2,1}(k).value;

    % Patent Applications, residents = IP.PAT.RESD
    US_IPpat_date{k} = US_indicator_data{1,2}{2,1}(k).date;
    US_IPpat_value{k} = US_indicator_data{1,2}{2,1}(k).value;

    % GDP per capita (current US$) Code = NY.GDP.PCAP.CD
    US_NYGDP_date{k} = US_indicator_data{1,3}{2,1}(k).date;
    US_NYGDP_value{k} = US_indicator_data{1,3}{2,1}(k).value;

end

% compile
US_data = [US_IPja_date; US_IPja_value; US_IPpat_date; US_IPpat_value;...
    US_NYGDP_date; US_NYGDP_value];

% transform
US_data = US_data';

% length of data
length(US_data)
   ans = 61
% display first 10 rows
disp(US_data(1:10,:))
    {'2020'}    {0×0 double  }    {'2020'}    {0×0 double}    {'2020'}    {[6.3414e+04]}
    {'2019'}    {0×0 double  }    {'2019'}    {[  285113]}    {'2019'}    {[6.5280e+04]}
    {'2018'}    {[4.2281e+05]}    {'2018'}    {[  285095]}    {'2018'}    {[6.3064e+04]}
    {'2017'}    {[4.3222e+05]}    {'2017'}    {[  293904]}    {'2017'}    {[6.0110e+04]}
    {'2016'}    {[4.2726e+05]}    {'2016'}    {[  295327]}    {'2016'}    {[5.8021e+04]}
    {'2015'}    {[4.2999e+05]}    {'2015'}    {[  288335]}    {'2015'}    {[5.6863e+04]}
    {'2014'}    {[4.3319e+05]}    {'2014'}    {[  285096]}    {'2014'}    {[5.5050e+04]}
    {'2013'}    {[4.2957e+05]}    {'2013'}    {[  287831]}    {'2013'}    {[5.3107e+04]}
    {'2012'}    {[4.2800e+05]}    {'2012'}    {[  268782]}    {'2012'}    {[5.1603e+04]}
    {'2011'}    {[4.2396e+05]}    {'2011'}    {[  247750]}    {'2011'}    {[4.9883e+04]}
% Convert the year data to numbers for plotting
USyears = cellfun(@str2num, US_data(:,1),'UniformOutput', false);

% since other year columns are the same, we can simplify this matrix
US_data = [USyears US_data(:,2) US_data(:,4) US_data(:,6)];

% display first 10 rows
disp(US_data(1:10,:))
    {[2020]}    {0×0 double  }    {0×0 double}    {[6.3414e+04]}
    {[2019]}    {0×0 double  }    {[  285113]}    {[6.5280e+04]}
    {[2018]}    {[4.2281e+05]}    {[  285095]}    {[6.3064e+04]}
    {[2017]}    {[4.3222e+05]}    {[  293904]}    {[6.0110e+04]}
    {[2016]}    {[4.2726e+05]}    {[  295327]}    {[5.8021e+04]}
    {[2015]}    {[4.2999e+05]}    {[  288335]}    {[5.6863e+04]}
    {[2014]}    {[4.3319e+05]}    {[  285096]}    {[5.5050e+04]}
    {[2013]}    {[4.2957e+05]}    {[  287831]}    {[5.3107e+04]}
    {[2012]}    {[4.2800e+05]}    {[  268782]}    {[5.1603e+04]}
    {[2011]}    {[4.2396e+05]}    {[  247750]}    {[4.9883e+04]}
% convert empty cells [] to NaN (this is required for plotting)
empties = cellfun('isempty',US_data);
US_data(empties) = {NaN};
US_data = cell2mat(US_data);

% display first 10 rows
% column 1: year
% column 2: Scientific and Technical Journal Article Data = IP.JRN.ARTC.SC
% column 3: Patent Applications, residents = IP.PAT.RESD
% column 4: GDP per capita (current US$) Code = NY.GDP.PCAP.CD

disp(US_data(1:10,:))
   1.0e+05 *

    0.0202       NaN       NaN    0.6341
    0.0202       NaN    2.8511    0.6528
    0.0202    4.2281    2.8510    0.6306
    0.0202    4.3222    2.9390    0.6011
    0.0202    4.2726    2.9533    0.5802
    0.0202    4.2999    2.8834    0.5686
    0.0201    4.3319    2.8510    0.5505
    0.0201    4.2957    2.8783    0.5311
    0.0201    4.2800    2.6878    0.5160
    0.0201    4.2396    2.4775    0.4988
% UK Data Compilation (same workflow as above)
for k = 1:length(UK_indicator_data{1, 1}{2, 1})

    % Scientific and Technical Journal Article Data = IP.JRN.ARTC.SC
    UK_IPja_date{k} = UK_indicator_data{1, 1}{2, 1}(k).date;
    UK_IPja_value{k} = UK_indicator_data{1, 1}{2, 1}(k).value;

    % Patent Applications, residents = IP.PAT.RESD
    UK_IPpat_date{k} = UK_indicator_data{1, 2}{2, 1}(k).date;
    UK_IPpat_value{k} = UK_indicator_data{1, 2}{2, 1}(k).value;

    % GDP per capita (current US$) Code = NY.GDP.PCAP.CD
    UK_NYGDP_date{k} = UK_indicator_data{1, 3}{2, 1}(k).date;
    UK_NYGDP_value{k} = UK_indicator_data{1, 3}{2, 1}(k).value;

end

UK_data = [UK_IPja_date; UK_IPja_value; UK_IPpat_date; UK_IPpat_value;...
    UK_NYGDP_date; UK_NYGDP_value];

UK_data = UK_data';

% length of data
length(UK_data)
   ans = 61
% we need to convert the year data to numbers for plotting
UKyears = cellfun(@str2num, UK_data(:,1),'UniformOutput', false);

% since other year columns are the same, we can simplify this matrix
UK_data = [UKyears UK_data(:,2) UK_data(:,4) UK_data(:,6)];

% convert empty cells [] to NaN (this is required for plotting)
empties = cellfun('isempty',UK_data);
UK_data(empties) = {NaN};
UK_data = cell2mat(UK_data);

% display first 10 rows
% column 1: year
% column 2: Scientific and Technical Journal Article Data = IP.JRN.ARTC.SC
% column 3: Patent Applications, residents = IP.PAT.RESD
% column 4: GDP per capita (current US$) Code = NY.GDP.PCAP.CD
disp(UK_data(1:10,:))
   1.0e+04 *

    0.2020       NaN       NaN    4.1125
    0.2019       NaN    1.2061    4.3070
    0.2018    9.7681    1.2865    4.3647
    0.2017    9.9129    1.3301    4.0858
    0.2016    9.9366    1.3876    4.1500
    0.2015    9.9616    1.4867    4.5405
    0.2014    9.9385    1.5196    4.7787
    0.2013    9.9228    1.4972    4.3714
    0.2012    9.8145    1.5370    4.2687
    0.2011    9.5820    1.5343    4.2285
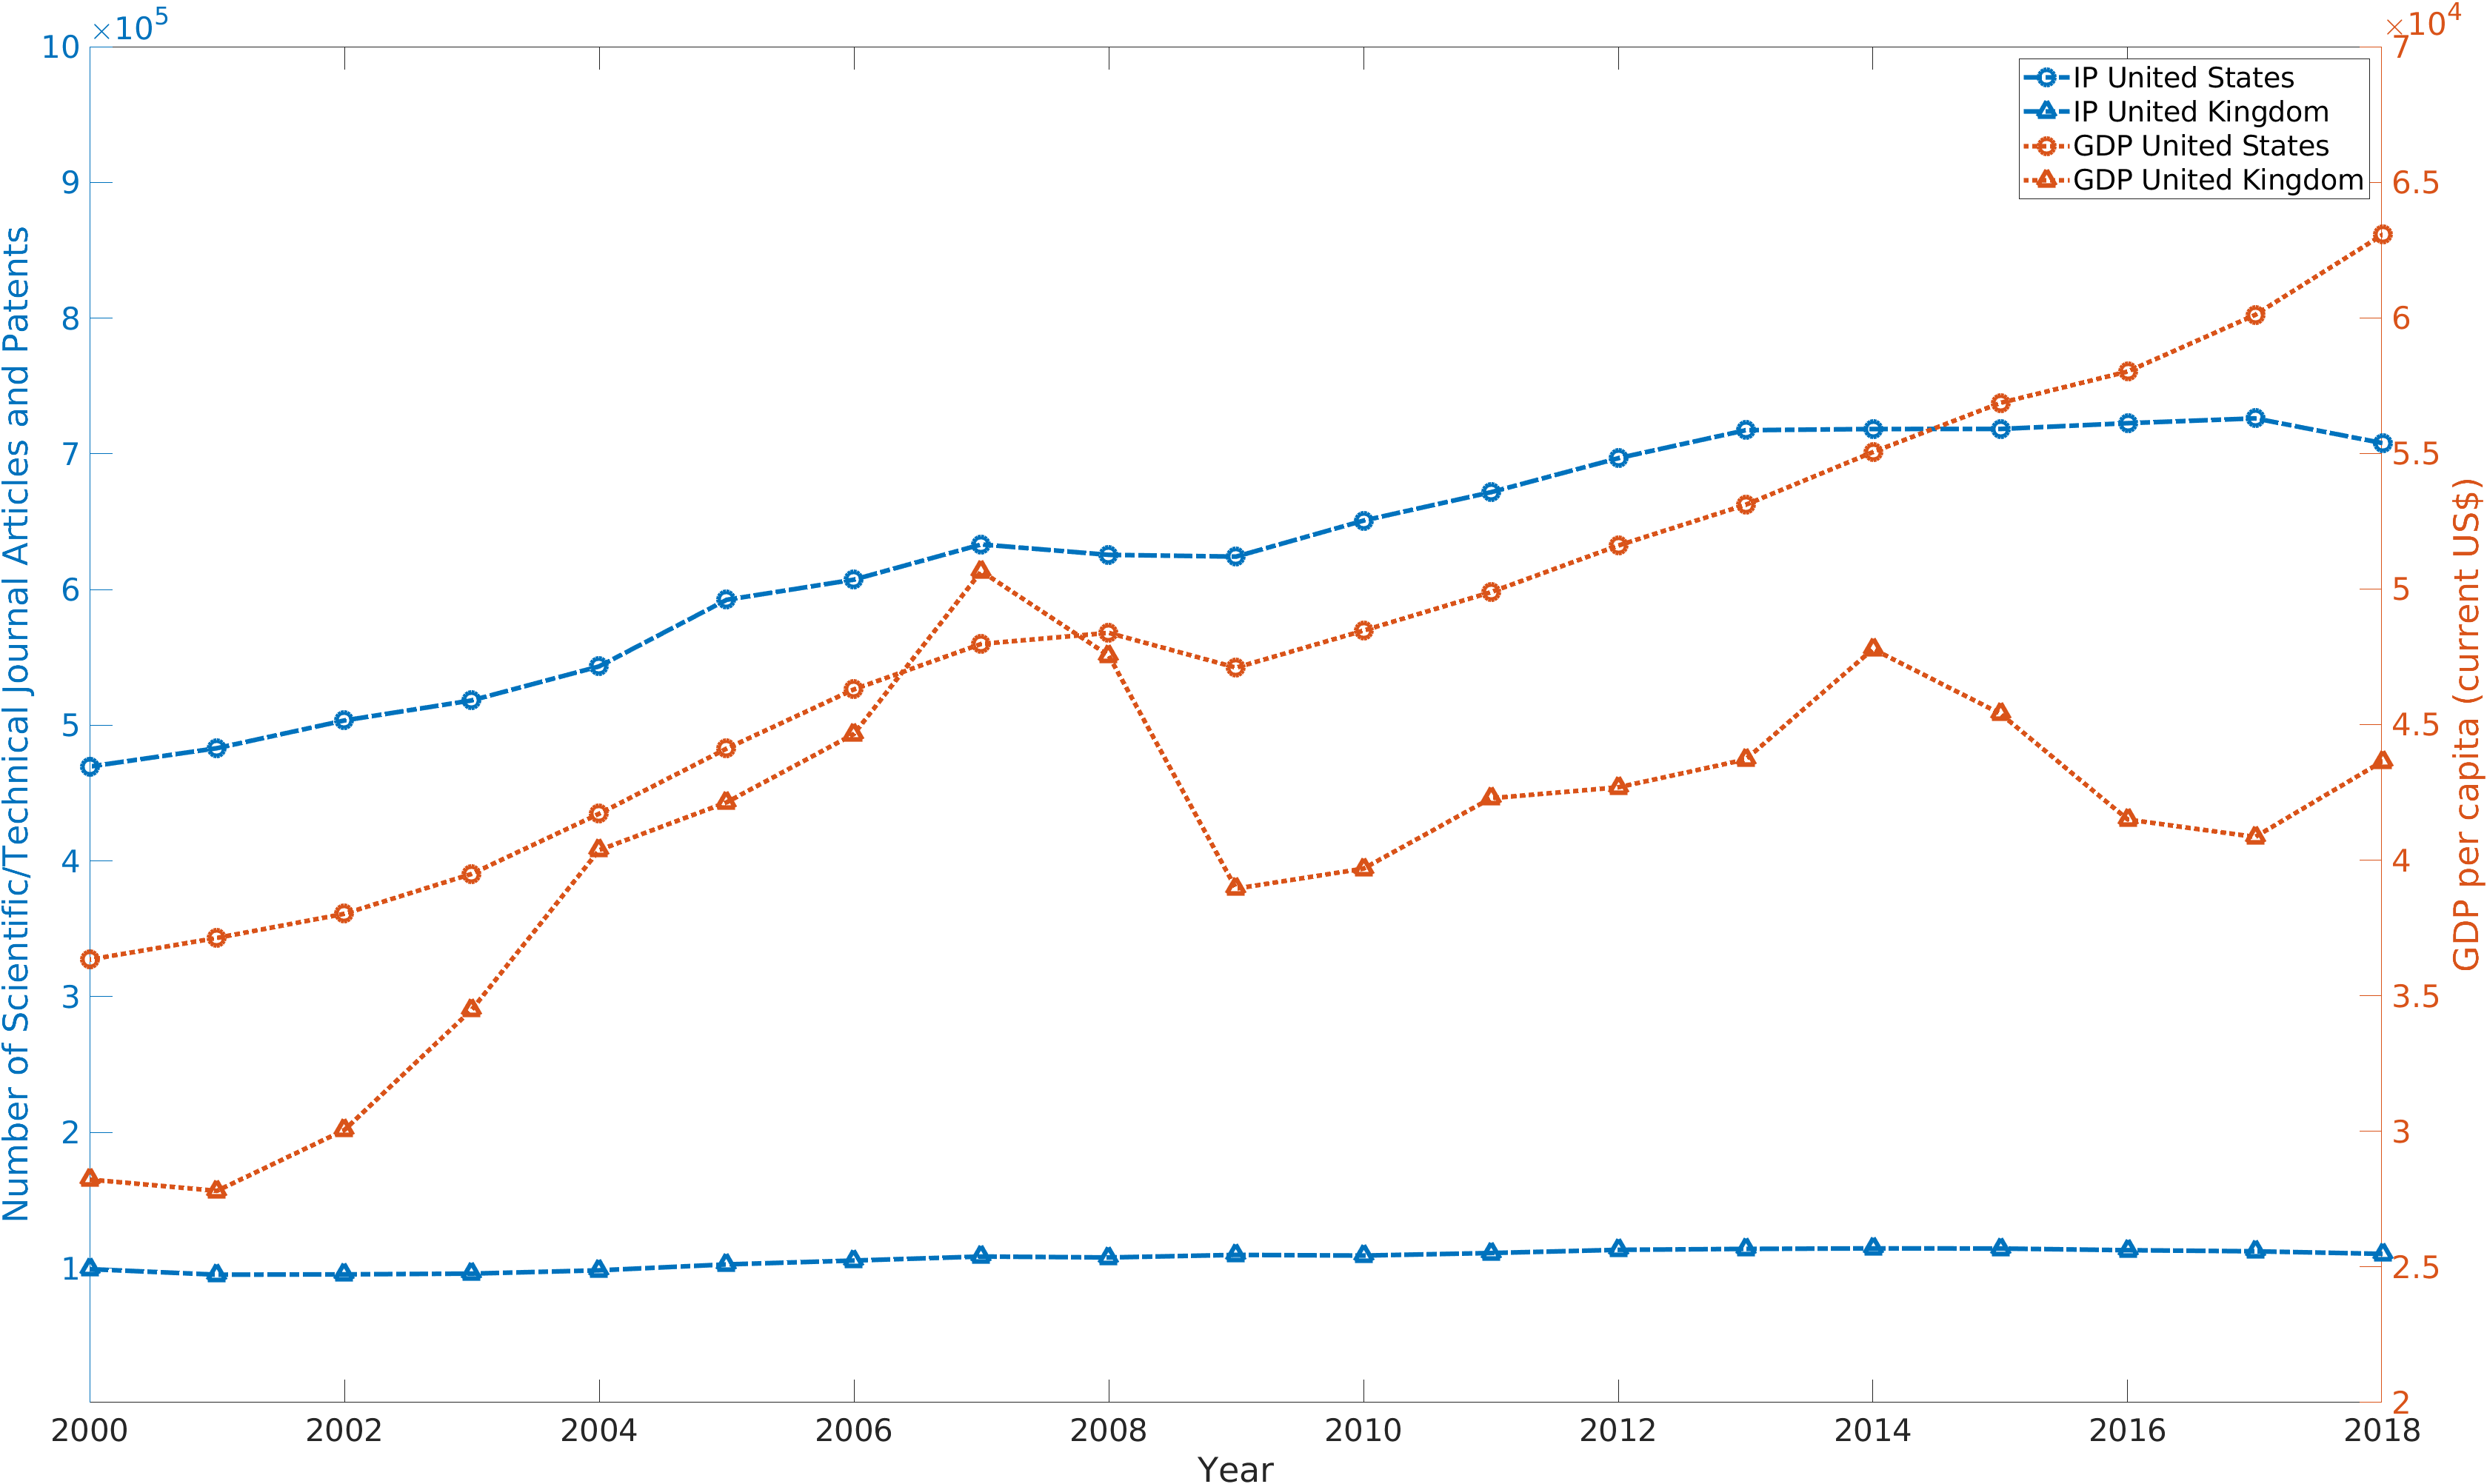
3. Plot Indicator data#
Create a line plot of US/UK Number of Scientific and Technical Journal Articles and Patents by year
% US/UK Number of Scientific and Technical Journal Articles and Patents (yleft)
% GDP per capita (current US$) Code = NY.GDP.PCAP.CD (yright)

figure
box on
hold on
xlabel('Year')
xlim([2000 2018])
ylim([1e+03 1e+06])
ylabel('Number of Scientific/Technical Journal Articles and Patents')
yyaxis left
plot(US_data(:,1),(US_data(:,2)+US_data(:,3)),'-.o',UK_data(:,1), (UK_data(:,2)+UK_data(:,3)),...
    '-.^','LineWidth', 3,'MarkerSize', 10)

yyaxis right
ylim([2e+04 7e+04])
ylabel('GDP per capita (current US$)')
plot(US_data(:,1),US_data(:,4),':o',UK_data(:,1), UK_data(:,4),...
    ':^','LineWidth', 3,'MarkerSize', 10)

legend('IP United States', 'IP United Kingdom', 'GDP United States','GDP United Kingdom')
hold off

% make figure wider
set(gcf, 'Units', 'Normalized', 'OuterPosition', [0 0 1 1]);
set(gca,'FontSize',20)