PubChem Periodic Table API in Python#
by Avery Fernandez and Vincent F. Scalfani
PubChem Periodic Table: https://pubchem.ncbi.nlm.nih.gov/periodic-table/
PubChem APIs Documentation: https://pubchemdocs.ncbi.nlm.nih.gov/programmatic-access
PubChem APIs Terms of Use: https://www.ncbi.nlm.nih.gov/home/about/policies/
PubChem is a database of chemical molecules and their properties. It is maintained by the National Center for Biotechnology Information (NCBI), a division of the National Library of Medicine (NLM) at the National Institutes of Health (NIH). PubChem is a key chemical information resource for scientists, students, and the general public.
These recipe examples were tested on February 23, 2024.
NOTE: The PubChem Periodic Table API limits requests to a maximum of 5 requests per second.
Import Libraries#
This tutorial uses the following libraries:
import requests                     # Manages API requests
from pprint import pprint           # Formats print outputs
import matplotlib.pyplot as plt     # Creates visualizations of data
1. Create a Periodic Table Data Structure#
To begin, we download the PubChem machine-readable periodic table data:
api_url = 'https://pubchem.ncbi.nlm.nih.gov/rest/pug/periodictable/JSON'
response = requests.get(api_url)

if response.status_code == 200:
    data = response.json()
    pprint(data, depth=2)
else:
    print('Error:', response.status_code)
{'Table': {'Columns': {...}, 'Row': [...]}}
From the output above, we can see the general structure of the data returned by the API. The Columns section of the data contains the categories of data stored for each element, and the Rows section contains those data points for each element.
# Print the categories
pprint(data['Table']['Columns']['Column'])
['AtomicNumber',
 'Symbol',
 'Name',
 'AtomicMass',
 'CPKHexColor',
 'ElectronConfiguration',
 'Electronegativity',
 'AtomicRadius',
 'IonizationEnergy',
 'ElectronAffinity',
 'OxidationStates',
 'StandardState',
 'MeltingPoint',
 'BoilingPoint',
 'Density',
 'GroupBlock',
 'YearDiscovered']
# Print the data associated with the first entry (Hydrogen)
pprint(data['Table']['Row'][0])
{'Cell': ['1',
          'H',
          'Hydrogen',
          '1.0080',
          'FFFFFF',
          '1s1',
          '2.2',
          '120',
          '13.598',
          '0.754',
          '+1, -1',
          'Gas',
          '13.81',
          '20.28',
          '0.00008988',
          'Nonmetal',
          '1766']}
Now we want to parse all periodic table data from structure array into a list of dictionaries using both list comprehension and dictionary comprehension. This data structure will be a list, with each element storing the data associated with an element as a dictionary.
elements = [
    {
        str(column): row["Cell"][idx]
        for idx, column in enumerate(data["Table"]["Columns"]["Column"])
    }
    for row in data["Table"]["Row"]
]
# Display first element (Hydrogen)
elements[0]
{'AtomicNumber': '1',
 'Symbol': 'H',
 'Name': 'Hydrogen',
 'AtomicMass': '1.0080',
 'CPKHexColor': 'FFFFFF',
 'ElectronConfiguration': '1s1',
 'Electronegativity': '2.2',
 'AtomicRadius': '120',
 'IonizationEnergy': '13.598',
 'ElectronAffinity': '0.754',
 'OxidationStates': '+1, -1',
 'StandardState': 'Gas',
 'MeltingPoint': '13.81',
 'BoilingPoint': '20.28',
 'Density': '0.00008988',
 'GroupBlock': 'Nonmetal',
 'YearDiscovered': '1766'}
2. Plot Melting and Boiling Points of Elements#
Create a new Atomic Number variable (AN) by converting AtomicNumber cell variable to a double array
AN = [int(cell["AtomicNumber"]) for cell in elements]

# Display atomic numbers of first 5 elements
AN[:5]
[1, 2, 3, 4, 5]
Create a new Melting Point variable (MP) by converting MeltingPoint cell variable to a double array
MP = [float(cell["MeltingPoint"]) if cell["MeltingPoint"] else float('nan') for cell in elements]

# Display melting points of first 5 elements
MP[:5]
[13.81, 0.95, 453.65, 1560.0, 2348.0]
Now we want to convert the Melting Point variable from Kelvin to Celsius
MPc = [x - 273.15 if x is not float('nan') else float('nan') for x in MP]

# Display melting points of first 5 elements (in Celcius)
MPc[:5]
[-259.34, -272.2, 180.5, 1286.85, 2074.85]
Create a new Boiling Point variable (BP) by converting BoilingPoint cell variable to a double array
BP = [float(cell["BoilingPoint"]) if cell["BoilingPoint"] else float('nan') for cell in elements]

# Display boiling points of first 5 elements
BP[:5]
[20.28, 4.22, 1615.0, 2744.0, 4273.0]
Now we want to convert the Boiling Point variable from Kelvin to Celsius
BPc = [x - 273.15 if x is not float('nan') else float('nan') for x in BP]

# Display boiling points of first 5 elements (in Celcius)
BPc[:5]
[-252.86999999999998, -268.92999999999995, 1341.85, 2470.85, 3999.85]
We can also extract the element symbol from the Element cell variable
Symbol = [str(cell["Symbol"]) for cell in elements]

# Display symbols of first 5 elements
Symbol[:5]
['H', 'He', 'Li', 'Be', 'B']
Now that the data has been formatted as lists, we can create some plots.
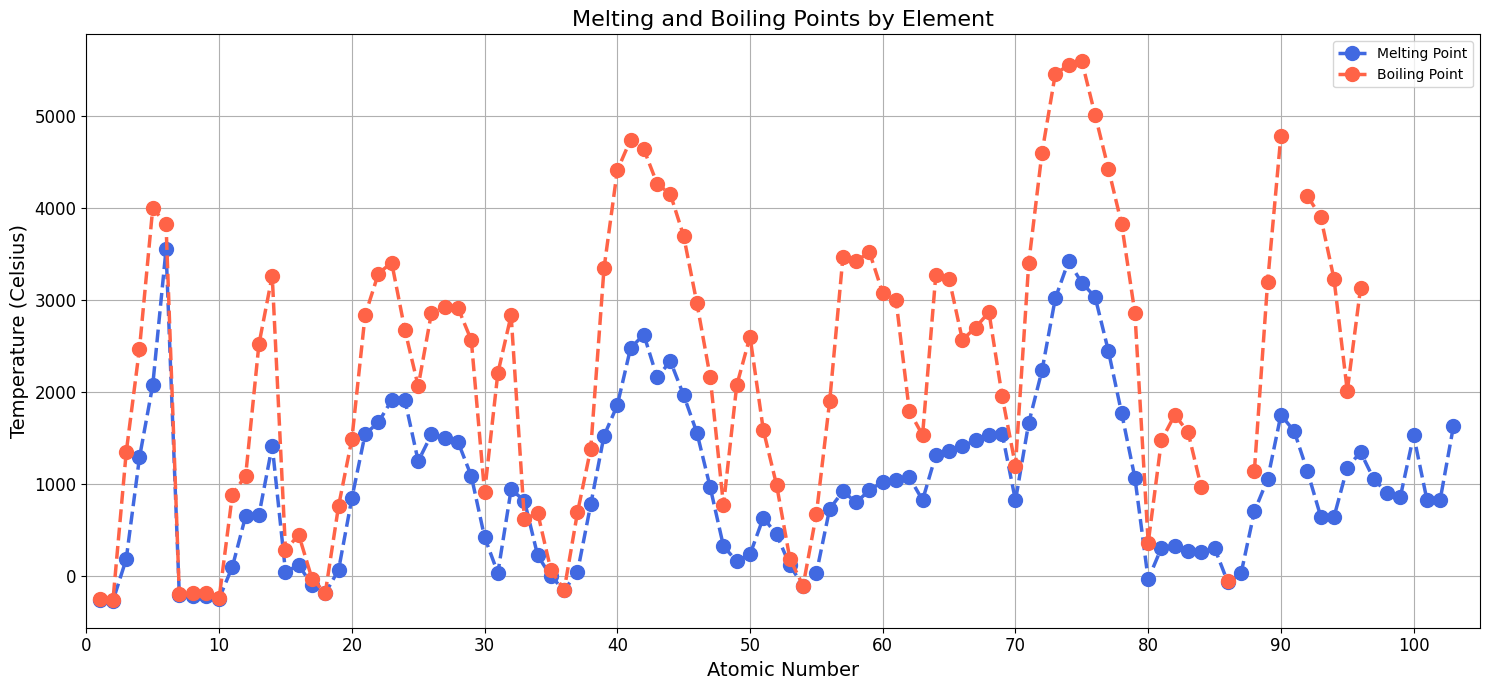
Line Plot#
fig, ax = plt.subplots(figsize=(15, 7))

ax.boxplot([MPc, BPc])
ax.set_xlabel('Atomic Number', fontsize=14)
ax.set_xlim([0, 105])
ax.set_ylabel('Temperature (Celsius)', fontsize=14)

mp_line, = ax.plot(AN, MPc, '--o', label='Melting Point', linewidth=2.5, markersize=10, color='royalblue')
bp_line, = ax.plot(AN, BPc, '--o', label='Boiling Point', linewidth=2.5, markersize=10, color='tomato')

ax.legend()
ax.grid(True)

ax.set_title('Melting and Boiling Points by Element', fontsize=16)

ax.set_xticks(range(0, 101, 10))
ax.set_xticklabels(range(0, 101, 10))

plt.xticks(fontsize=12)
plt.yticks(fontsize=12)
plt.tight_layout()
plt.show()
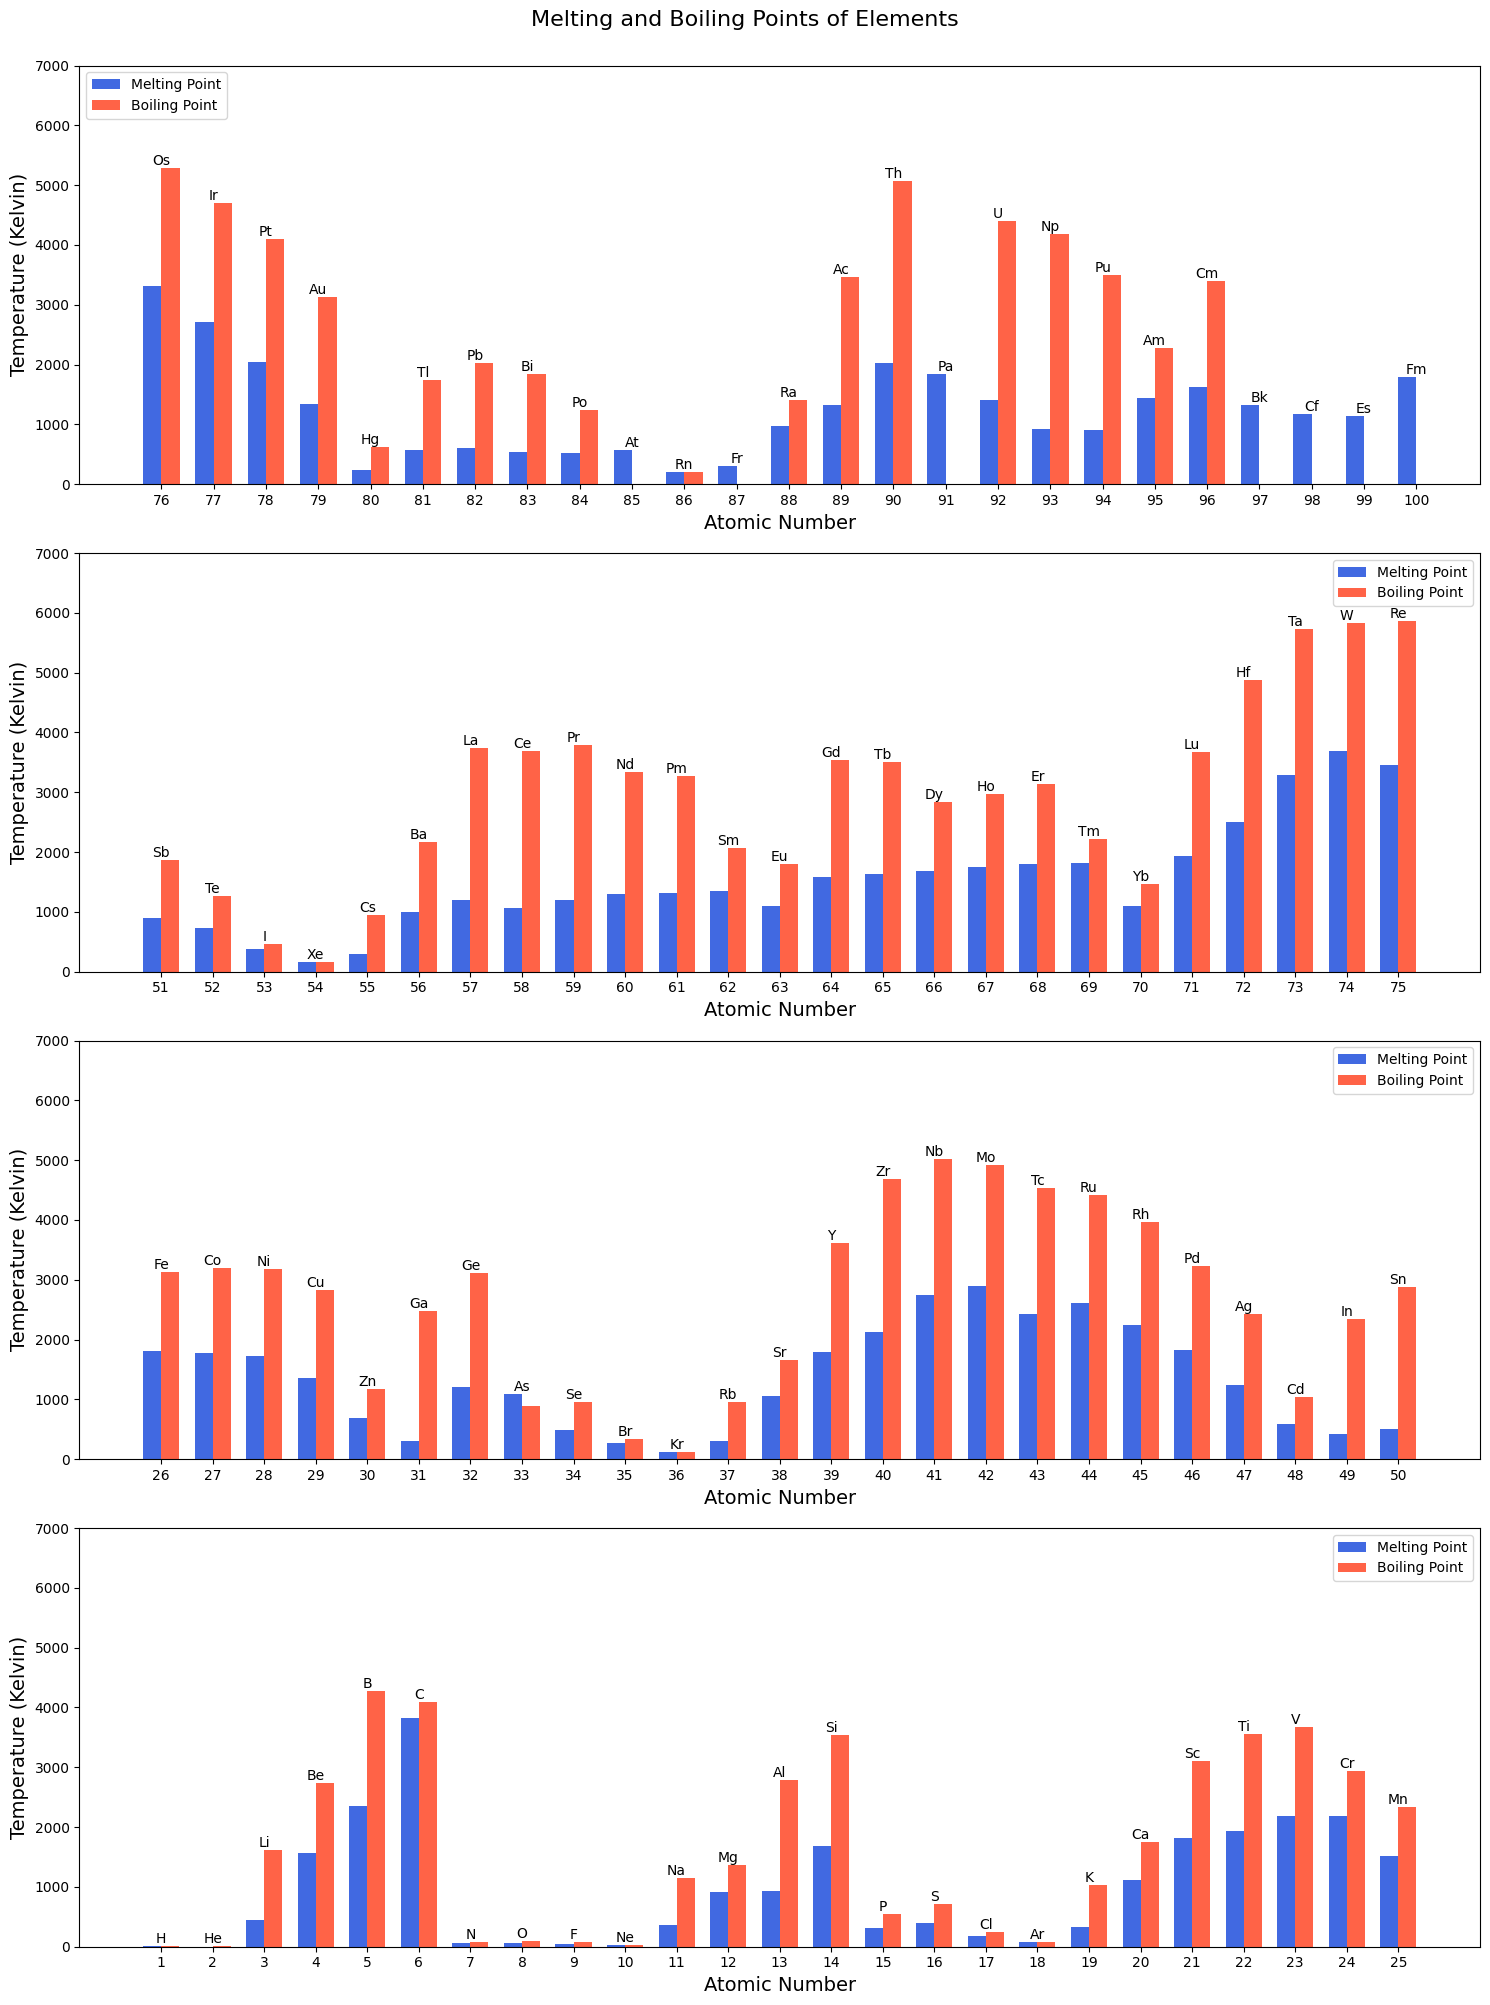
Grouped Bar Chart#
# Plot grouped bar chart of Melting Point and Boiling Point
fig, axs = plt.subplots(nrows=4, ncols=1, figsize=(15, 20))

# Define a function to plot the bar charts
def plot_bar_chart(ax, start, end):
    # Grabs the values for the given range
    x = AN[start:end]
    y1 = MP[start:end]
    y2 = BP[start:end]
    symbols = Symbol[start:end]

    width = 0.35
    # Create the two bars
    bars1 = ax.bar([p - width / 2 for p in x], y1, width, label='Melting Point', color='royalblue')
    bars2 = ax.bar([p + width / 2 for p in x], y2, width, label='Boiling Point', color='tomato')

    # Creates the labels along with limiting the y axis to 0-7000
    ax.set_xticks(x)
    ax.set_ylim([0, 7000])
    ax.set_xlabel('Atomic Number', fontsize=14)
    ax.set_ylabel('Temperature (Kelvin)', fontsize=14)
    ax.legend()

    # Adds the atomic symbols on the top of the bars
    for i, label in enumerate(symbols):
        ax.text(x[i], max(y1[i], y2[i]), label, ha='center', va='bottom')

# Plot elements 1-25
plot_bar_chart(axs[3], 0, 25)

# Plot elements 26-50
plot_bar_chart(axs[2], 25, 50)

# Plot elements 51-75
plot_bar_chart(axs[1], 50, 75)

# Plot elements 76-100
plot_bar_chart(axs[0], 75, 100)

fig.suptitle('Melting and Boiling Points of Elements', fontsize=16, y=1)

plt.tight_layout()
plt.show()