National Weather Service (NWS) API in Python#
by Michael T. Moen
NWS API Documentation: https://www.weather.gov/documentation/services-web-api
NWS Terms of Use: From the documentation, “All of the information presented via the API is intended to be open data, free to use for any purpose.”
These recipe examples were tested on February 23, 2024.
NOTE: The NWS API imposes a rate limit on requests, but the amount is not published. We recommend using a 1 second delay between API requests.
Setup#
User Agent Information#
A User Agent is required to access the NWS API. The User Agent identifies what application or program the is accessing the NWS API.
Add your application name and email below:
user_agent = {"User-Agent": "Application name, email@domain.com"}
Alternatively, you can save the above data in a separate python file and import it:
from user_agent import user_agent
Import Libraries#
This tutorial uses the following libraries:
import requests                     # Manages API requests
import matplotlib.pyplot as plt     # Creates visualization of data
import matplotlib.dates as mdates   # Provides functionality for working with dates in matplotlib plots
from time import sleep              # Allows staggering of API requests to conform to rate limits
from dateutil import parser         # Parses datetime strings into datetime objects
1. Get the 12 hour forecast for a location#
The NWS publishes weather forecasts for each of its Weather Forecast Offices. A map of these offices and the regions they cover can be found here: https://www.weather.gov/srh/nwsoffices
In order to obtain the forecast for a location, we must query that region’s Weather Forecast Office using its code and the grid coordinates of the location. To determine these values for a location, we can query the /points endpoint.
To see how to programmatically obtain the latititude and longitude of an address in the U.S., please see our U.S. Census Geocoding cookbook tutorials.
latitude = '33.211952'
longitude = '-87.545920'

url = f'https://api.weather.gov/points/{latitude},{longitude}'
response = requests.get(url, headers=user_agent).json()

# Display response from API
response
{'@context': ['https://geojson.org/geojson-ld/geojson-context.jsonld',
  {'@version': '1.1',
   'wx': 'https://api.weather.gov/ontology#',
   's': 'https://schema.org/',
   'geo': 'http://www.opengis.net/ont/geosparql#',
   'unit': 'http://codes.wmo.int/common/unit/',
   '@vocab': 'https://api.weather.gov/ontology#',
   'geometry': {'@id': 's:GeoCoordinates', '@type': 'geo:wktLiteral'},
   'city': 's:addressLocality',
   'state': 's:addressRegion',
   'distance': {'@id': 's:Distance', '@type': 's:QuantitativeValue'},
   'bearing': {'@type': 's:QuantitativeValue'},
   'value': {'@id': 's:value'},
   'unitCode': {'@id': 's:unitCode', '@type': '@id'},
   'forecastOffice': {'@type': '@id'},
   'forecastGridData': {'@type': '@id'},
   'publicZone': {'@type': '@id'},
   'county': {'@type': '@id'}}],
 'id': 'https://api.weather.gov/points/33.212,-87.5459',
 'type': 'Feature',
 'geometry': {'type': 'Point', 'coordinates': [-87.5459, 33.212]},
 'properties': {'@id': 'https://api.weather.gov/points/33.212,-87.5459',
  '@type': 'wx:Point',
  'cwa': 'BMX',
  'forecastOffice': 'https://api.weather.gov/offices/BMX',
  'gridId': 'BMX',
  'gridX': 33,
  'gridY': 69,
  'forecast': 'https://api.weather.gov/gridpoints/BMX/33,69/forecast',
  'forecastHourly': 'https://api.weather.gov/gridpoints/BMX/33,69/forecast/hourly',
  'forecastGridData': 'https://api.weather.gov/gridpoints/BMX/33,69',
  'observationStations': 'https://api.weather.gov/gridpoints/BMX/33,69/stations',
  'relativeLocation': {'type': 'Feature',
   'geometry': {'type': 'Point', 'coordinates': [-87.5283, 33.234404]},
   'properties': {'city': 'Tuscaloosa',
    'state': 'AL',
    'distance': {'unitCode': 'wmoUnit:m', 'value': 2981.0037391988},
    'bearing': {'unitCode': 'wmoUnit:degree_(angle)', 'value': 213}}},
  'forecastZone': 'https://api.weather.gov/zones/forecast/ALZ023',
  'county': 'https://api.weather.gov/zones/county/ALC125',
  'fireWeatherZone': 'https://api.weather.gov/zones/fire/ALZ023',
  'timeZone': 'America/Chicago',
  'radarStation': 'KBMX'}}
office = response["properties"]["gridId"]
gridX = response["properties"]["gridX"]
gridY = response["properties"]["gridY"]

# Print grid location data
print(f'Office code: {office}, Grid coordinates: {gridX}, {gridY}')
Office code: BMX, Grid coordinates: 33, 69
Now that we have obtained the grid coordinates and office code, we can use the /gridpoints endpoint to obtain the seven day forecast:
url = f'https://api.weather.gov/gridpoints/{office}/{gridX},{gridY}/forecast'
response = requests.get(url, headers=user_agent).json()

# Display first result
response["properties"]["periods"][0]
{'number': 1,
 'name': 'This Afternoon',
 'startTime': '2024-02-23T13:00:00-06:00',
 'endTime': '2024-02-23T18:00:00-06:00',
 'isDaytime': True,
 'temperature': 69,
 'temperatureUnit': 'F',
 'temperatureTrend': None,
 'probabilityOfPrecipitation': {'unitCode': 'wmoUnit:percent', 'value': None},
 'dewpoint': {'unitCode': 'wmoUnit:degC', 'value': 7.222222222222222},
 'relativeHumidity': {'unitCode': 'wmoUnit:percent', 'value': 45},
 'windSpeed': '10 to 15 mph',
 'windDirection': 'NW',
 'icon': 'https://api.weather.gov/icons/land/day/few?size=medium',
 'shortForecast': 'Sunny',
 'detailedForecast': 'Sunny, with a high near 69. Northwest wind 10 to 15 mph.'}
Finally, we can print the data we are interested in. In this case, we’re looking at the temperature, probability of precipitation, and detailed forecast.
for day in response["properties"]["periods"]:
    name = day["name"]
    temperature = day["temperature"]
    rain = day["probabilityOfPrecipitation"]["value"] or 0
    forecast = day["detailedForecast"]
    print(f'{name:<16}: {temperature:>3}F, {rain:>3}%, {forecast}')
This Afternoon  :  69F,   0%, Sunny, with a high near 69. Northwest wind 10 to 15 mph.
Tonight         :  44F,   0%, Clear, with a low around 44. West wind 5 to 10 mph.
Saturday        :  66F,   0%, Sunny. High near 66, with temperatures falling to around 61 in the afternoon. Northwest wind 5 to 15 mph.
Saturday Night  :  35F,   0%, Clear, with a low around 35. Northeast wind 5 to 10 mph.
Sunday          :  69F,   0%, Sunny. High near 69, with temperatures falling to around 63 in the afternoon. Southeast wind 5 to 10 mph.
Sunday Night    :  48F,   0%, Mostly clear, with a low around 48.
Monday          :  77F,   0%, Sunny, with a high near 77.
Monday Night    :  59F,   0%, Partly cloudy, with a low around 59.
Tuesday         :  80F,   0%, Partly sunny, with a high near 80.
Tuesday Night   :  63F,  20%, A slight chance of rain showers after midnight. Mostly cloudy, with a low around 63. Chance of precipitation is 20%.
Wednesday       :  73F,  50%, A chance of showers and thunderstorms. Mostly cloudy, with a high near 73. Chance of precipitation is 50%.
Wednesday Night :  46F,  40%, A chance of showers and thunderstorms. Mostly cloudy, with a low around 46. Chance of precipitation is 40%.
Thursday        :  61F,  20%, A slight chance of showers and thunderstorms. Mostly sunny, with a high near 61. Chance of precipitation is 20%.
Thursday Night  :  47F,  50%, A chance of showers and thunderstorms before midnight, then a chance of showers and thunderstorms. Partly cloudy, with a low around 47. Chance of precipitation is 50%.
2. Get the hourly forecast for a location#
The /gridpoints endpoint can also return an hourly forecast for a seven day period. The function below implements the code from the example above using this hourly forecast method:
# Note that this function only works with valid latitude and longitude inputs
def getHourlyForecast(latitude, longitude, user_agent):

    points_url = f'https://api.weather.gov/points/{latitude},{longitude}'
    points_response = requests.get(points_url, headers=user_agent).json()
    office = points_response["properties"]["gridId"]
    gridX = points_response["properties"]["gridX"]
    gridY = points_response["properties"]["gridY"]

    sleep(1)    # Add 1 second delay between API requests

    # The addition of the "/hourly" to the end of this URL is the only difference between the hourly and daily forecasts
    gridpoints_url = f'https://api.weather.gov/gridpoints/{office}/{gridX},{gridY}/forecast/hourly'
    gridpoints_response = requests.get(gridpoints_url, headers=user_agent).json()
    return gridpoints_response["properties"]["periods"]
The function can be easily used as such:
latitude = '33.211952'
longitude = '-87.545920'
hourlyForecast = getHourlyForecast(latitude, longitude, user_agent)
len(hourlyForecast)
156
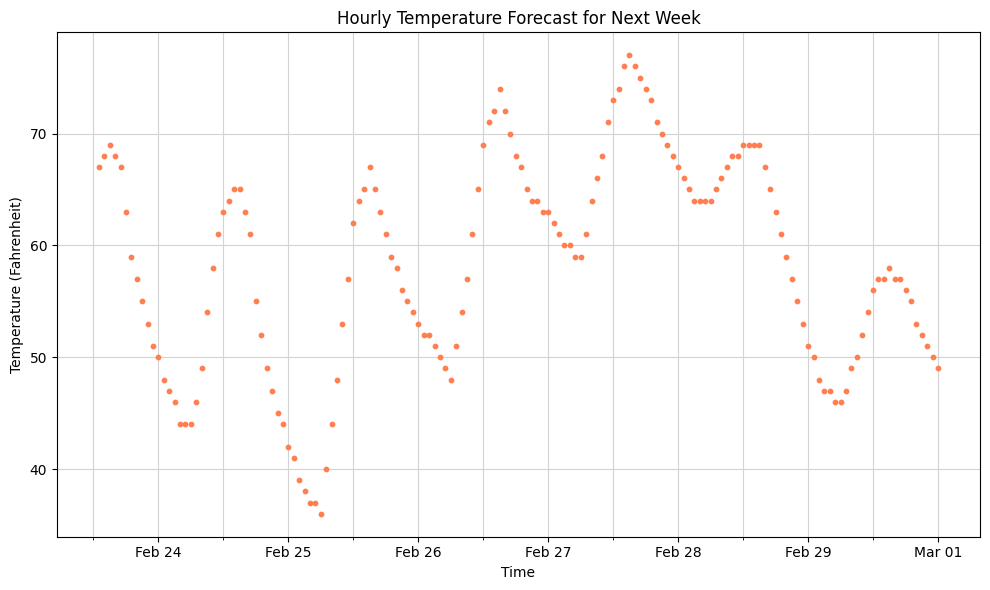
Lastly, we can use matplotlib to graph the temperature data:
hours = []
temperatures = []
for hourForecast in hourlyForecast:
    hour = parser.parse(hourForecast["startTime"][:19])
    hours.append(hour)
    temperatures.append(hourForecast["temperature"])

plt.figure(figsize=(10, 6))
plt.scatter(hours, temperatures, color='coral', marker='o', s=10)
plt.title('Hourly Temperature Forecast for Next Week')
plt.xlabel('Time')
plt.ylabel('Temperature (Fahrenheit)')
plt.grid(True, which='both', color='lightgray')
plt.gca().set_axisbelow(True)
plt.gca().xaxis.set_major_locator(mdates.HourLocator(byhour=0))
plt.gca().xaxis.set_major_formatter(mdates.DateFormatter('%b %d'))
plt.gca().xaxis.set_minor_locator(mdates.HourLocator(byhour=12))
plt.gca().xaxis.set_minor_formatter(mdates.DateFormatter(''))
plt.tight_layout()
plt.show()
3. Get alerts for a location#
This use-case is for demonstration purposes. To get current weather alerts in the U.S., be sure to also check your local NWS website directly (e.g., for Birmingham, AL area, see: https://www.weather.gov/bmx/).
The /alerts endpoint returns all alerts issued for a given location or area. The example below uses the point parameter to find all alerts for a pair of coordinates:
latitude = '33.211952'
longitude = '-87.545920'

url = f'https://api.weather.gov/alerts/active?point={latitude},{longitude}'
response = requests.get(url, headers=user_agent).json()

# Display response from API
response
{'@context': {'@version': '1.1'},
 'type': 'FeatureCollection',
 'features': [],
 'title': 'Current watches, warnings, and advisories for 33.211952 N, 87.54592 W',
 'updated': '2024-02-17T00:00:00+00:00'}
Note that there are no active alerts in the result above.
The example below uses the area parameter to find all alerts for the state of Alabama:
state = 'AL'

url = f'https://api.weather.gov/alerts/active?area={state}'
response = requests.get(url, headers=user_agent).json()

# Display response from API
response['features']
[{'id': 'https://api.weather.gov/alerts/urn:oid:2.49.0.1.840.0.bd6153ef80e4aa2cc8ef67860f33f8dccf01d19b.001.1',
  'type': 'Feature',
  'geometry': None,
  'properties': {'@id': 'https://api.weather.gov/alerts/urn:oid:2.49.0.1.840.0.bd6153ef80e4aa2cc8ef67860f33f8dccf01d19b.001.1',
   '@type': 'wx:Alert',
   'id': 'urn:oid:2.49.0.1.840.0.bd6153ef80e4aa2cc8ef67860f33f8dccf01d19b.001.1',
   'areaDesc': 'Mobile Coastal; Baldwin Coastal; Escambia Coastal; Santa Rosa Coastal; Okaloosa Coastal',
   'geocode': {'SAME': ['001097', '001003', '012033', '012113', '012091'],
    'UGC': ['ALZ265', 'ALZ266', 'FLZ202', 'FLZ204', 'FLZ206']},
   'affectedZones': ['https://api.weather.gov/zones/forecast/ALZ265',
    'https://api.weather.gov/zones/forecast/ALZ266',
    'https://api.weather.gov/zones/forecast/FLZ202',
    'https://api.weather.gov/zones/forecast/FLZ204',
    'https://api.weather.gov/zones/forecast/FLZ206'],
   'references': [],
   'sent': '2024-02-23T13:08:00-06:00',
   'effective': '2024-02-23T13:08:00-06:00',
   'onset': '2024-02-23T13:08:00-06:00',
   'expires': '2024-02-23T22:00:00-06:00',
   'ends': '2024-02-24T06:00:00-06:00',
   'status': 'Actual',
   'messageType': 'Alert',
   'category': 'Met',
   'severity': 'Moderate',
   'certainty': 'Likely',
   'urgency': 'Expected',
   'event': 'Rip Current Statement',
   'sender': 'w-nws.webmaster@noaa.gov',
   'senderName': 'NWS Mobile AL',
   'headline': 'Rip Current Statement issued February 23 at 1:08PM CST until February 24 at 6:00AM CST by NWS Mobile AL',
   'description': '* WHAT...Dangerous rip currents.\n\n* WHERE...In Alabama, Mobile Coastal and Baldwin Coastal\nCounties. In Florida, Escambia Coastal, Santa Rosa Coastal and\nOkaloosa Coastal Counties.\n\n* WHEN...Through late tonight.\n\n* IMPACTS...Rip currents can sweep even the best swimmers away\nfrom shore into deeper water.',
   'instruction': "Swim near a lifeguard. If caught in a rip current, relax and\nfloat. Don't swim against the current. If able, swim in a\ndirection following the shoreline. If unable to escape, face the\nshore and call or wave for help.",
   'response': 'Avoid',
   'parameters': {'AWIPSidentifier': ['CFWMOB'],
    'WMOidentifier': ['WHUS44 KMOB 231908'],
    'NWSheadline': ['HIGH RIP CURRENT RISK REMAINS IN EFFECT THROUGH LATE TONIGHT'],
    'BLOCKCHANNEL': ['EAS', 'NWEM', 'CMAS'],
    'VTEC': ['/O.CON.KMOB.RP.S.0007.000000T0000Z-240224T1200Z/'],
    'eventEndingTime': ['2024-02-24T12:00:00+00:00'],
    'expiredReferences': ['w-nws.webmaster@noaa.gov,urn:oid:2.49.0.1.840.0.70345bf491fe21f0db1b5964f2b8364de86995f8.001.1,2024-02-23T04:56:00-06:00 w-nws.webmaster@noaa.gov,urn:oid:2.49.0.1.840.0.828dd06944269a0d0ad4ec031f4aa1b7ae372686.001.1,2024-02-22T21:28:00-06:00 w-nws.webmaster@noaa.gov,urn:oid:2.49.0.1.840.0.6855a2a47102d526aae1769aef222329cccf8bd5.001.1,2024-02-22T13:07:00-06:00 w-nws.webmaster@noaa.gov,urn:oid:2.49.0.1.840.0.f566540bba690d5159ffe102b5f70192c708c39a.001.1,2024-02-22T06:11:00-06:00 w-nws.webmaster@noaa.gov,urn:oid:2.49.0.1.840.0.ea0d41539efa6eb01e5c7831c7b16b35dee0a259.001.1,2024-02-21T21:51:00-06:00 w-nws.webmaster@noaa.gov,urn:oid:2.49.0.1.840.0.762c6681e40b5427a745a7b08d271b70f9ceb41d.001.1,2024-02-21T13:57:00-06:00']}}}]
As we can see from the example above, there is one alert in the state of Alabama:
response['features'][0]['properties']['headline']
'Rip Current Statement issued February 23 at 1:08PM CST until February 24 at 6:00AM CST by NWS Mobile AL'